One Variable Statistics
Students were asked how many family members live in their house. The table shows the data.
| Family members | Frequency |
|---|---|
| $2$ | $1$ |
| $3$ | $8$ |
| $4$ | $6$ |
| $5$ | $3$ |
| $6$ | $2$ |
| $7$ | $4$ |
| $8$ | $1$ |
Entering Data
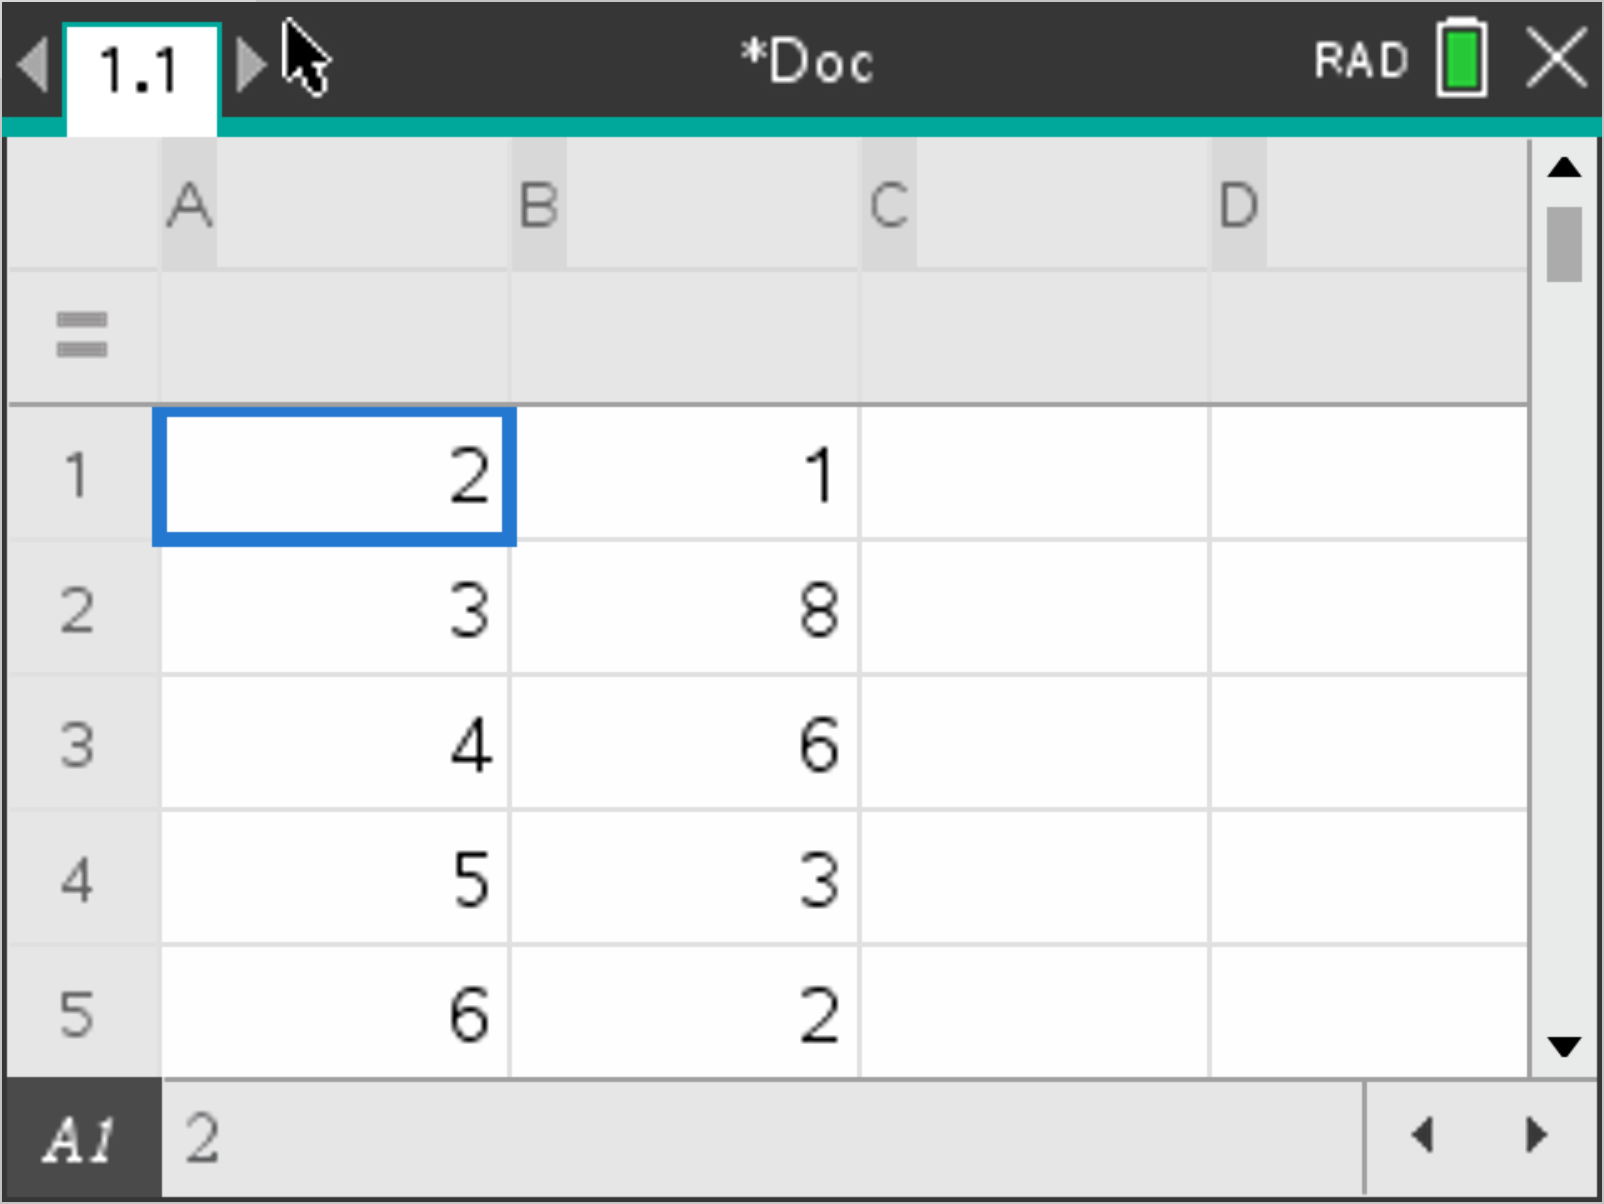
- Open a Lists & Spreadsheet page.
- Enter the "Family members" in column A. Enter their frequencies in column B.
Calculating Statistics
To calculate statistics from the data,
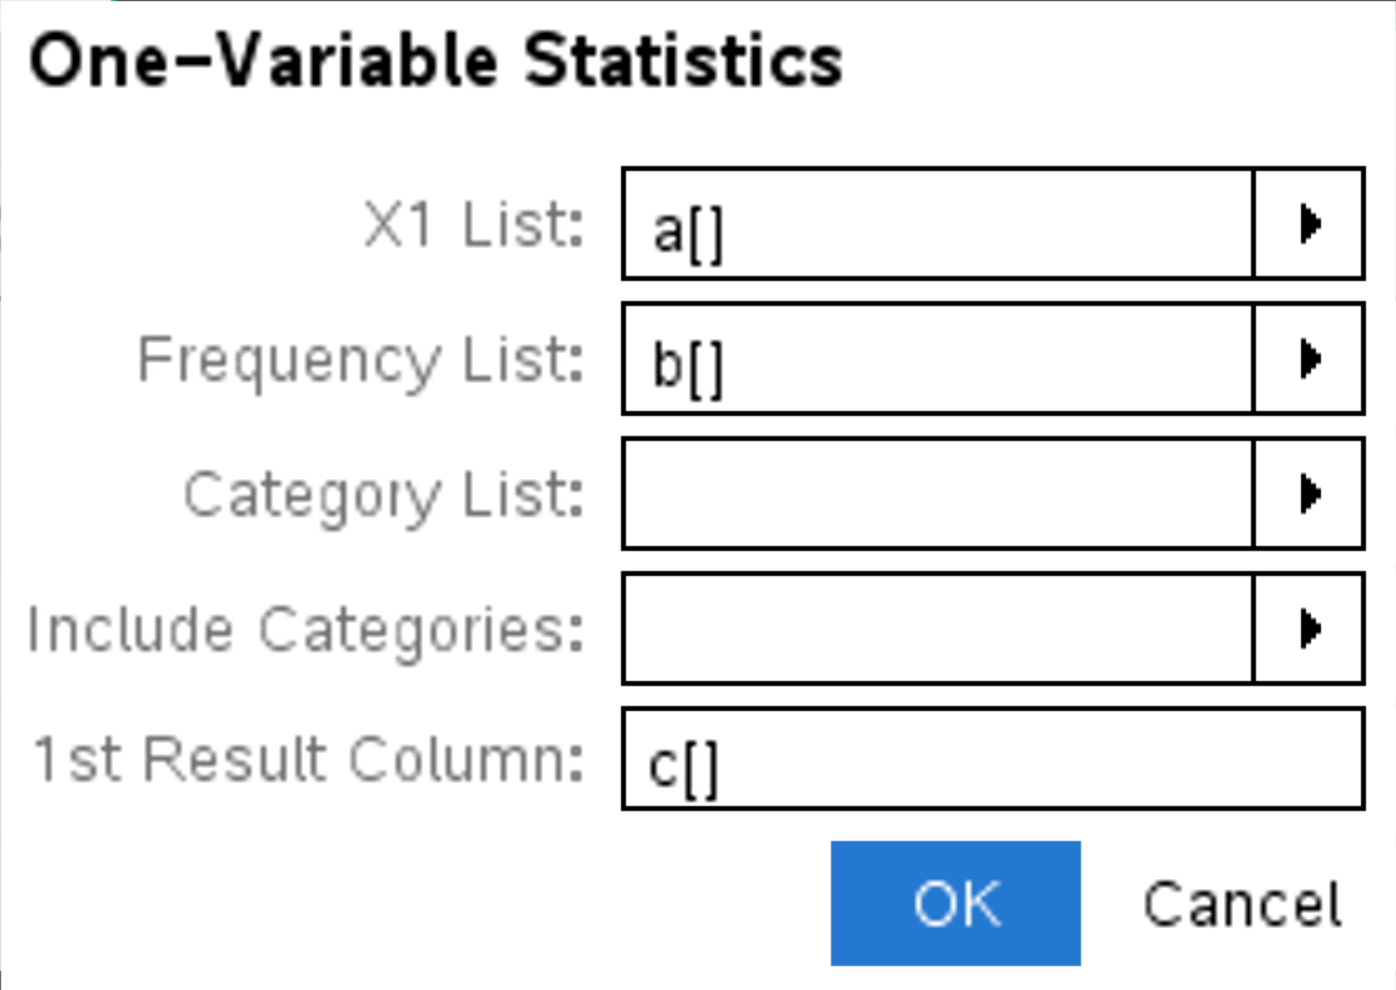
- press menu > "4 Statistics" > "1 Stat Calculations" > "1 One-Variable Statistics..."
- set "Num of Lists:" to "1" and press enter
- set the following and select "OK"
Use the direction buttons to find the:
- mean $\quad \bar x=$
- number of data values $\quad n=$
- minimum $\quad MinX=$
- lower quartile $\quad Q_1X=$
- median $\quad MedianX=$
- upper quartile $\quad Q_3X=$
- maximum $\quad MaxX=$
- standard deviation to 3 significant figures $\quad \sigma x=$