Two Variable Statistics
To study the relationship between time spent studying and grades, 20 students in a class were surveyed.
Their responses were as follows.
Their responses were as follows.
| Time Spent Studying (hours) |
Average Grade (%) |
|---|---|
| $12$ | $68$ |
| $16$ | $82$ |
| $10$ | $69$ |
| $6$ | $39$ |
| $12.5$ | $74$ |
| $14$ | $76$ |
| $10$ | $64$ |
| $9$ | $62$ |
| $7$ | $55$ |
| $20$ | $93$ |
| $14.5$ | $80$ |
| $14$ | $72$ |
| $12$ | $91$ |
| $4$ | $43$ |
| $7.5$ | $58$ |
| $12$ | $75$ |
| $6$ | $61$ |
| $21$ | $82$ |
| $13$ | $82$ |
| $13.5$ | $78$ |
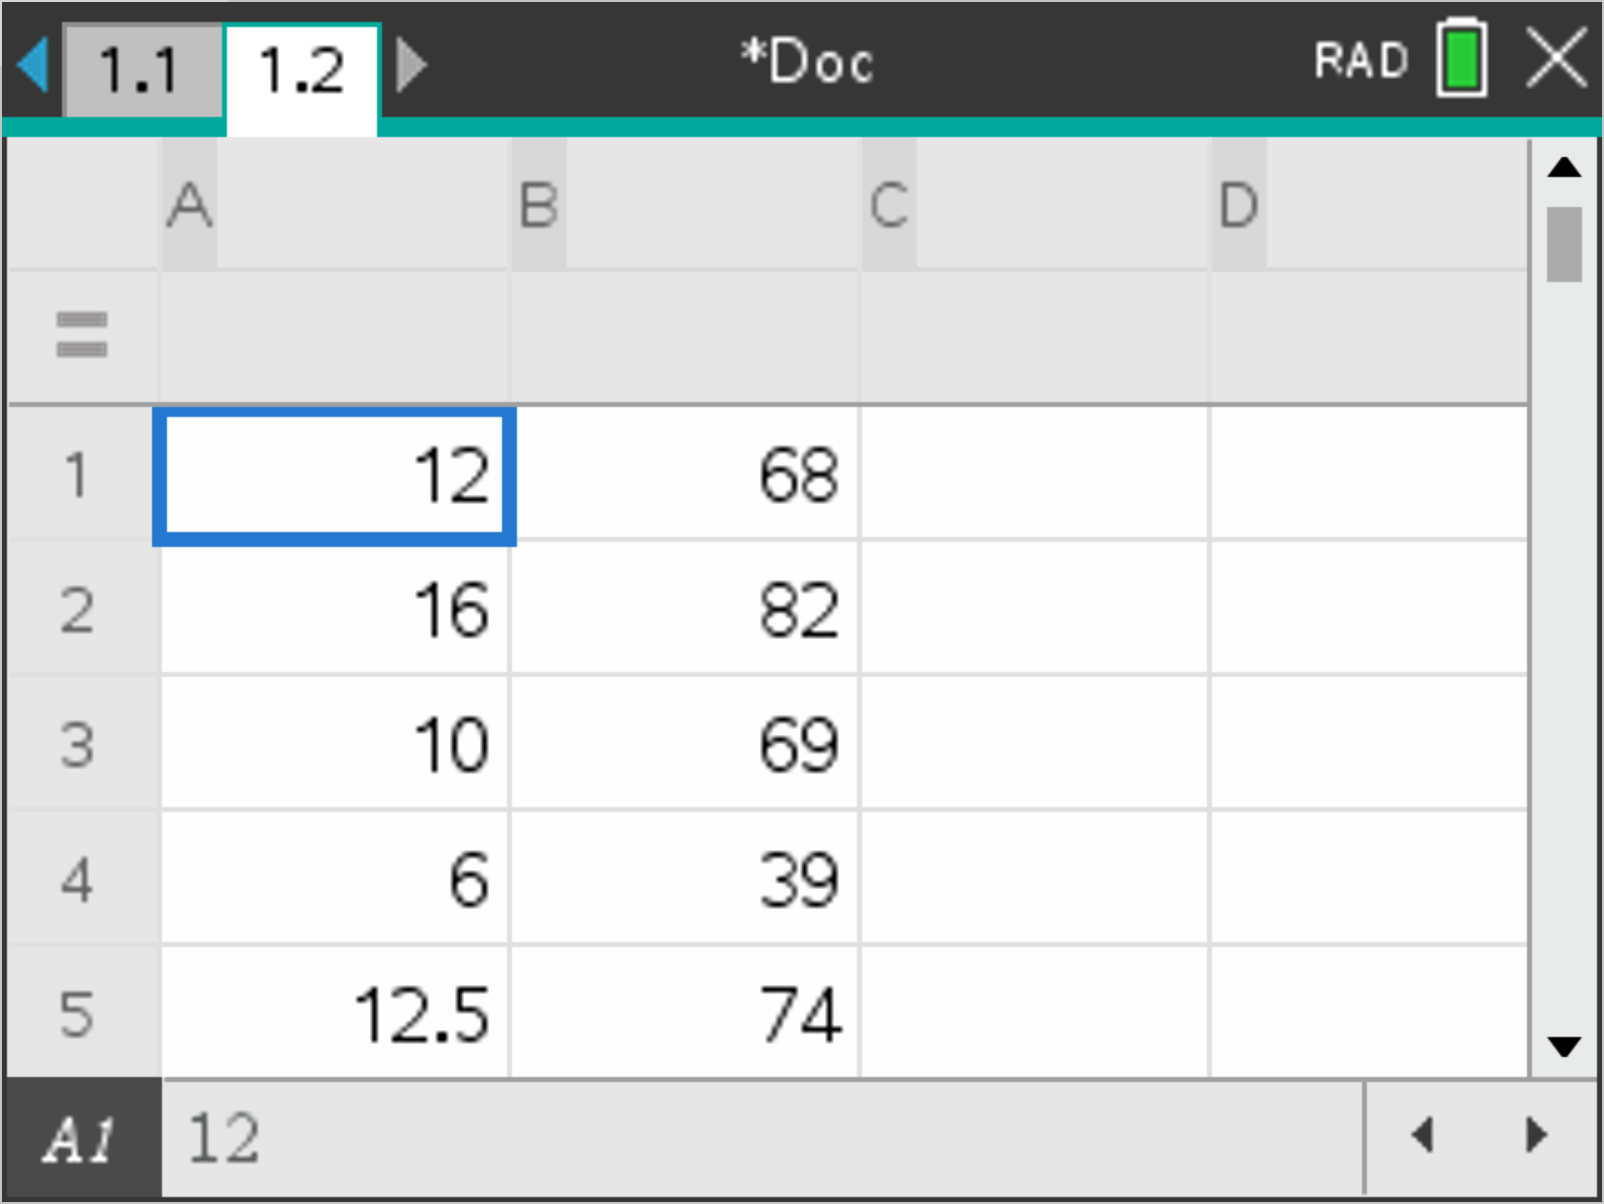
Entering Data
- Open a Lists & Spreadsheet page.
- Enter the "Time Spent Studying" in column A.
Enter the corresponding "Average Grade" in column B.
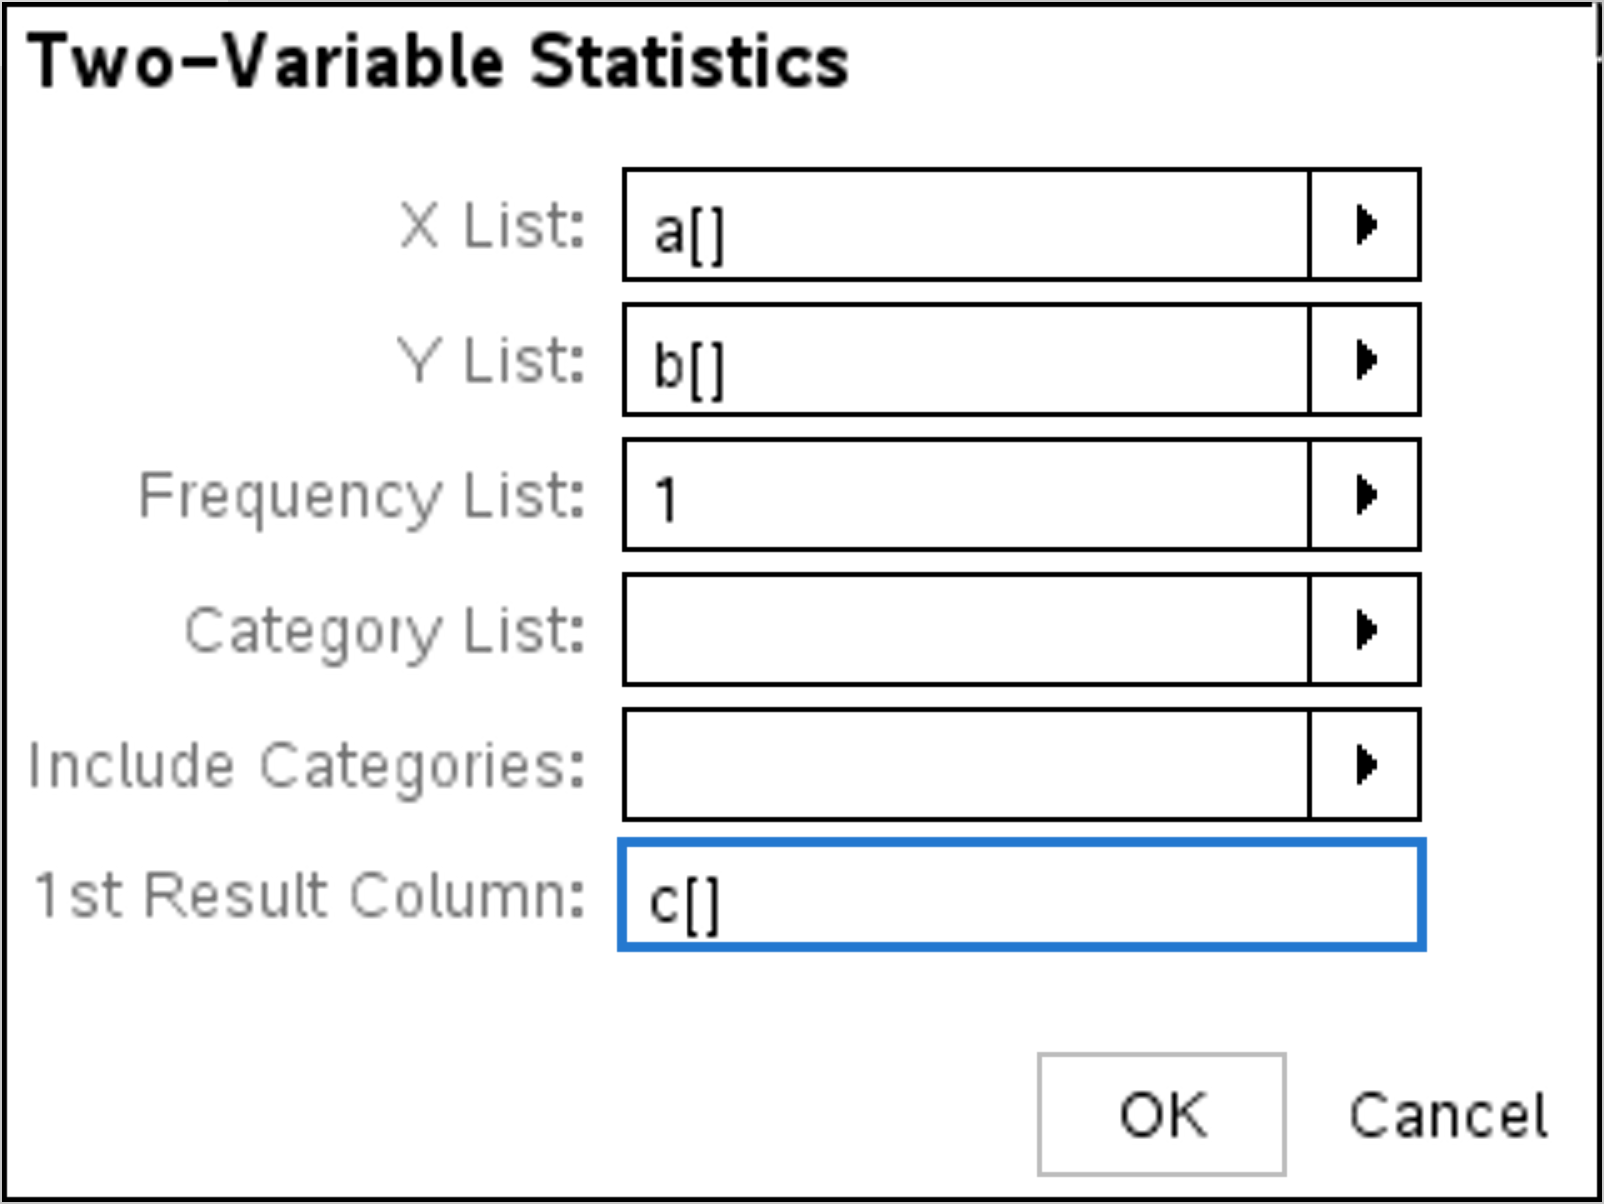
Calculating Statistics
To calculate statistics from the data,
- press menu > "4 Statistics" > "1 Stat Calculations" > "2 Two-Variable Statistics..."
- set the following and select "OK"
Use the direction buttons to find the:
- mean time spent studying $\quad \bar x=$
- mean average grade $\quad \bar y=$
- correlation coefficient to 3 significant figures $\quad r=$
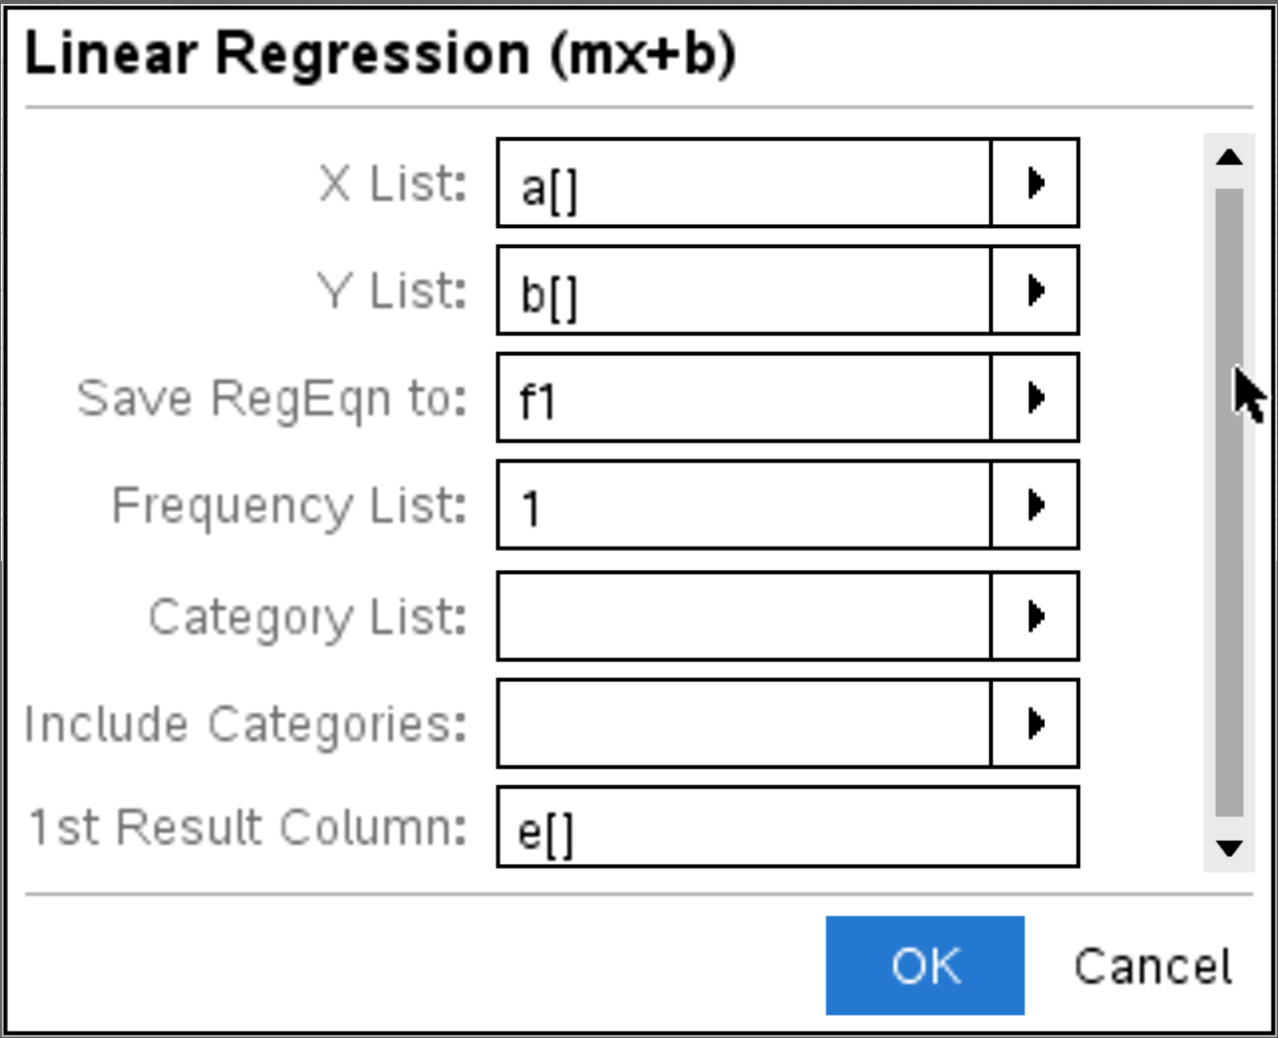
Regression Line
To find the regression line,
- press menu > "4 Statistics" > "1 Stat Calculations" > "3 Linear Regression (mx+b)..."
- set the following and select "OK"
- Use the direction buttons to find the equation of the regression line in the form $y=mx+b$.
Round values to 3 significant figures.
$y=$ $x+$ - Using the equation of the regression line, estimate the average grade for a student who studies $15$ hours.
Round to 3 significant figures.